We used StorTrack’s Explorer platform to dig into key market metrics.
Market Snapshot for Southwest Florida
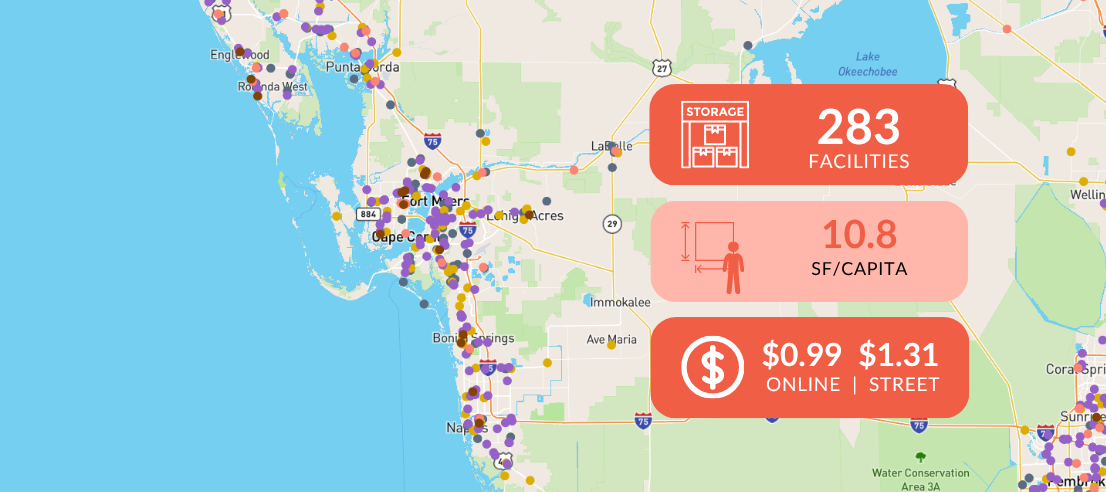
Among the three markets, Punta Gorda is the most supply-dense at 12.2 square feet per capita despite having the smallest population (~201,000). Cape Coral–Fort Myers, the region’s largest market, holds over 60% of inventory and maintains 11.3 square feet per capita. Naples–Marco Island, with the lowest supply density at 9.1 square feet per capita, has the highest median household income ($86,000 vs. $75,000 regional average), aligning with the highest advertised rental rates among the three MSAs.
That pricing premium is stark across both walk-in and online rates. Climate-controlled walk-in rates average $1.91 per square foot in Naples, sharply higher than $1.20 in Cape Coral-Fort Myers and $1.11 in Punta Gorda. Online rates follow the same hierarchy, reinforcing Naples-Marco Island’s position as the region’s highest-priced market despite having the lowest supply density among the three MSAs.
|
|||||||||||||
| Walk-In Rate ($/sqft) | Online Rate ($/sqft) | ||||||||||||
| MSA | Stores | NRSF | SF/Capita | Population | Med. Income | NCC | CC | Avg. | NCC | CC | Avg. | ||
| Cape Coral-Fort Myers | 165 | 9,298,784 | 11.29 | 823,866 | $73,099 | $1.00 | $1.20 | $1.14 | $0.78 | $0.88 | $0.85 | ||
| Naples-Marco Island | 65 | 3,618,354 | 9.07 | 398,846 | $86,173 | $1.28 | $1.91 | $1.74 | $0.99 | $1.41 | $1.30 | ||
| Punta Gorda | 53 | 2,441,853 | 12.17 | 200,715 | $66,154 | $0.92 | $1.11 | $1.04 | $0.71 | $0.87 | $0.81 | ||
| Southwest Florida | 283 | 15,358,991 | 10.8 | 1,423,427 | $75,142 | $1.07 | $1.41 | $1.31 | $0.83 | $1.05 | $0.99 | ||
| NCC = Non-climate controlled | CC = Climate controlled | Avg. = blended average rate | |||||||||||||
View the Free Report for these MSAs ➝
Note: This report covers individual analysis and metrics for each MSA through May 2026. For smaller market analysis, Explorer allows radius-based searches from 1 to 10 miles. Learn more: www.StorTrack.com/Explorer
Public REIT disclosures provide only a limited market-level read across Southwest Florida, as Naples–Marco Island and Punta Gorda are generally grouped into broader “Other Markets” categories. The clearest REIT datapoint comes from CubeSmart’s Cape Coral–Fort Myers portfolio, where six stores totaling 442,000 NRSF reported average occupancy of 82.3% and net rent of $19.15 per occupied square foot. While not directly comparable across all three MSAs, that disclosure supports Cape Coral–Fort Myers’ role as the region’s primary institutional reference point, with the largest inventory base and the broadest visibility into operating conditions. Overall, these differences show how local demographics, migration flows, and supply conditions shape the pricing and competitive landscape across Southwest Florida.
📍Analyze Southwest Florida—and Beyond
Want deeper insights on Southwest Florida or other markets? Explore facility counts, rate trends, demographic shifts, new development activity and more with StorTrack’s Explorer platform.
![]()